SIP Debugger
Monitor your SIP connections and providers.
The Cloudonix SIP Debugger provides comprehensive telemetry into the SIP signalling layer, enabling deep diagnostic capabilities for call infrastructure analysis.
It captures and visualizes all SIP messages including SIP INVITE, 200 OK, 404 Not Found, 408 Timeout, and RTP payload metadata. The debugger exposes message timestamps, sequence numbers, and state transitions, allowing engineers to trace call lifecycle events with millisecond precision.
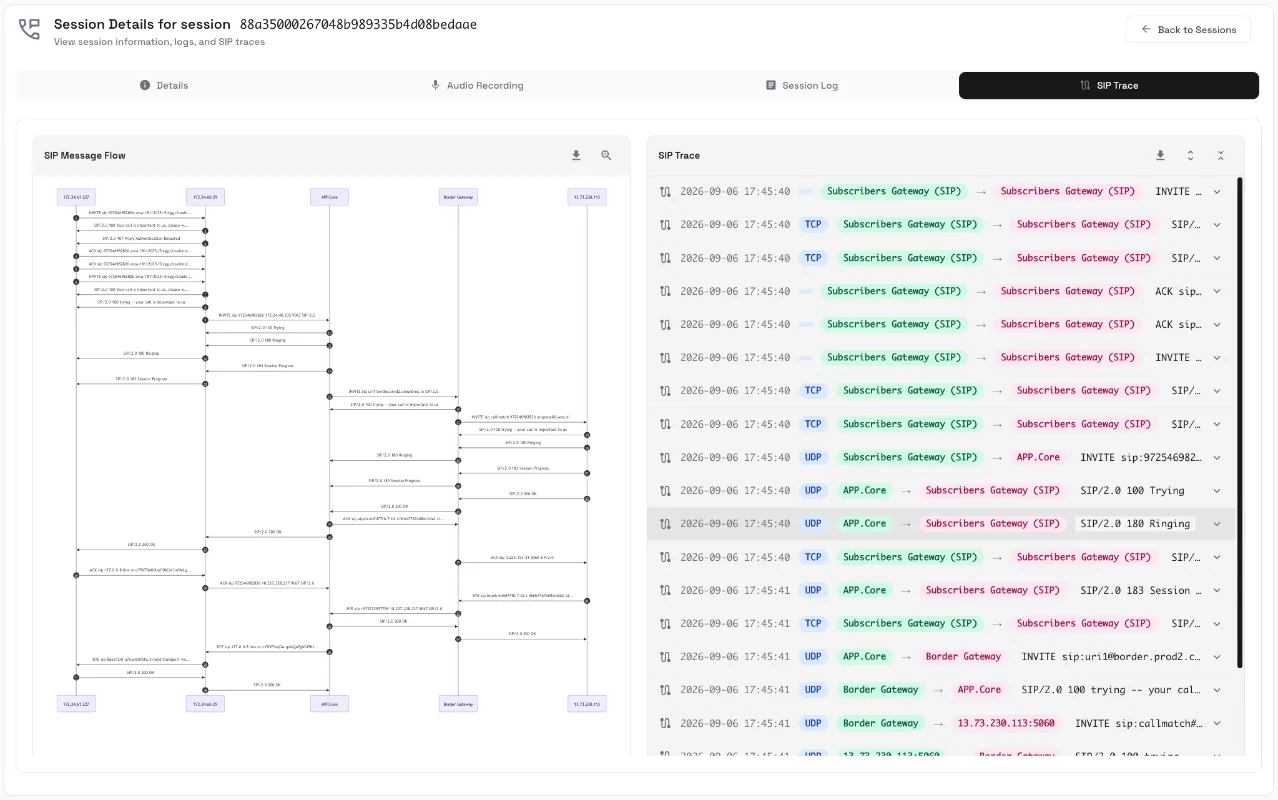
Aligned with Cloudonix's engineering commitment to transparency by making the invisible visible—reducing mean time to resolution (MTTR) by eliminating blind spots in call routing and signaling logic. Integration is seamless via REST API and SDK hooks throughout the cloud-native stack.
Frequently asked questions
What exactly does the Cloudonix SIP Debugger let me see?
It captures and visualizes the full SIP signaling layer, including messages like SIP INVITE, 200 OK, 404 Not Found, and 408 Timeout, plus RTP payload metadata, timestamps, sequence numbers, and call state transitions.
Can I use the SIP Debugger to trace the lifecycle of a call?
Yes. The debugger exposes message timestamps, sequence numbers, and state transitions so engineers can trace call lifecycle events with millisecond precision.
How does the SIP Debugger integrate with my existing stack?
Integration is seamless via REST API and SDK hooks throughout Cloudonix's cloud-native stack, so you can incorporate diagnostics into your existing workflows.
Will the SIP Debugger help me resolve call routing and signaling issues faster?
It's designed to reduce mean time to resolution (MTTR) by making the invisible visible and eliminating blind spots in call routing and signaling logic.
Does the SIP Debugger support monitoring of third-party SIP providers?
Yes, it's built to monitor your SIP connections and providers, giving you comprehensive telemetry into the SIP signaling layer across your call infrastructure.
What kind of metadata is available for RTP payloads?
The debugger captures RTP payload metadata alongside SIP messages, helping engineers correlate signaling events with media-layer details during diagnostic analysis.